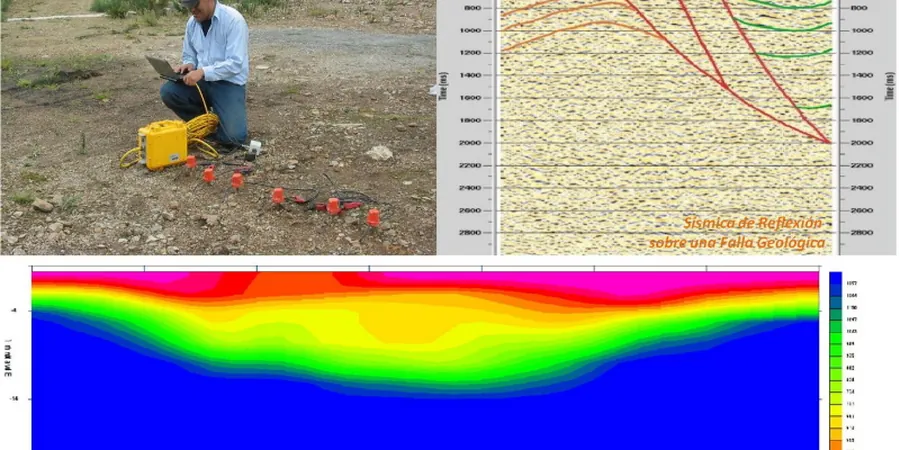
Seismic tomography surveys in Newmarket must contend with the complex stratigraphy of the Oak Ridges Moraine, where glaciofluvial sand and gravel channels alternate with dense Halton Till at variable depths. The 2015 National Building Code of Canada (NBCC) and the Ontario Building Code require site-specific shear-wave velocity (Vs) profiles for Class C, D, and E sites within the Greater Toronto Area seismic zone, making high-resolution refraction and reflection tomography a critical first step in any geotechnical investigation along the Yonge Street corridor. Our field crews deploy 48-channel Geometrics Geode seismographs with 4.5 Hz geophones spaced at 2.0 to 3.0 m intervals, configuring shot points at both ends and mid-spread to achieve dense ray coverage beneath the water table. Processing follows ASTM D5777-18 guidelines, using wavepath eikonal traveltime tomography (WET) for P-wave velocity models and iterative inversion routines that resolve lateral velocity contrasts indicative of buried valleys or till discontinuities. On projects where the target depth exceeds 25 m, we complement the refraction survey with a MASW profile to constrain the Vs30 value required for NBCC site class determination, ensuring the velocity model extends to the 30 m reference depth.
A 48-channel refraction spread with 2.5 m geophone spacing resolves a buried bedrock valley to within ±0.3 m vertical accuracy across the Oak Ridges Moraine.
Methodology and scope
Local considerations
The 48-channel Geometrics Geode system deployed on Newmarket sites weighs approximately 38 kg in its field-ready configuration with two 24-channel modules, external battery, and trigger cable harness, allowing a two-person crew to roll spreads efficiently along municipal rights-of-way even in late-season conditions when frost penetration in November reaches 15–20 cm. The largest operational risk specific to the Oak Ridges Moraine is the presence of a dry, unsaturated sand layer 2–4 m thick above the water table, which attenuates high-frequency P-wave energy and reduces first-arrival signal-to-noise ratio below the 5:1 threshold required for reliable traveltime picking. To mitigate this, we pre-condition shot holes with a light water flush and increase stack counts to 8–10 impacts, while simultaneously recording a co-located seismic reflection line that images the water table reflector at the 1,500 m/s velocity contour. Cultural noise from heavy truck traffic on Davis Drive and the GO Transit rail corridor introduces 15–30 Hz coherent noise that we suppress with a 35 Hz low-cut filter during acquisition and FK-domain filtering during processing. A second concern is the seasonal variation in near-surface velocity caused by frost; we normalize all refraction data to a +4°C reference temperature using a velocity correction factor of 2.5% per degree Celsius.
Applicable standards
ASTM D5777-18 – Standard Guide for Using the Seismic Refraction Method, NBCC 2015 – National Building Code of Canada, Seismic Hazard (Table 4.1.8.4.A), ASTM D7128-18 – Standard Guide for Using the Seismic Reflection Method, MoE CPT-2016 – Ontario Ministry of the Environment noise and vibration guidelines
Associated technical services
2D Refraction Tomography for Bedrock Mapping
Four to six spreads per field day, each 115 m long with 48 geophones, delivering a continuous P-wave velocity cross-section to depths of 35 m. Used for foundation bearing stratum verification, rippability assessment, and karst feature detection in the Bobcaygeon Formation limestone underlying the moraine.
Combined Refraction + MASW for NBCC Site Classification
Simultaneous P-wave refraction and surface-wave acquisition along the same spread, yielding both a compressional-wave tomography model and a 1D shear-wave velocity profile to 30 m. Outputs include Vs30, site class per NBCC Table 4.1.8.4.A, and the velocity contrast map required for seismic hazard analysis.
High-Resolution Seismic Reflection Profiling
CMP-based reflection acquisition with 2 ms sampling and 24-fold coverage, processed through deconvolution, NMO, and post-stack migration. Applied to aquifer delineation in the lower drift deposits, tunnel alignment studies, and deep paleovalley mapping where refraction tomography cannot resolve velocity inversions.
Typical parameters
Frequently asked questions
What depth of investigation can a seismic refraction survey achieve on a typical Newmarket site?
In the sand-and-till stratigraphy of the Oak Ridges Moraine, a 115 m spread with a mid-spread shot can reliably image refractors to depths of 30–35 m, assuming a velocity gradient that increases with depth. The practical limit is governed by the signal-to-noise ratio of the first arrivals: in saturated sand with a water table at 4–6 m depth, an 8 kg sledgehammer source generates usable P-wave energy to approximately 40 m. For deeper targets such as the bedrock surface below 50 m of drift, we switch to reflection profiling or combine the refraction line with a co-located MASW survey to extend the Vs model to the 30 m NBCC reference depth.
How does frost penetration affect seismic velocities during a winter survey?
Frozen ground increases near-surface P-wave velocity by 30–60% compared to the same material at +4°C, which can artificially shallow the interpreted refractor depth if not corrected. Our protocol in Newmarket during November through March applies a temperature-dependent velocity correction based on hourly ground-temperature measurements at 10 cm depth, and we schedule reflection shots within two hours of noon when the uppermost 5–10 cm may have thawed. The correction factor we use—approximately 2.5% per degree Celsius—derives from published relationships by Zimmerman and King (1986) and has been validated against summer repeat lines on the same moraine sites.
What is the expected cost range for a combined refraction and MASW survey in Newmarket?
A typical combined survey covering 230–345 linear metres with 48-channel refraction and co-located MASW acquisition, including processing, interpretation, and a signed report, falls between CA$3,450 and CA$7,460 depending on site access conditions, number of spreads, and whether a supplementary reflection line is required. Projects within the urban core of Newmarket where traffic control and utility locates add mobilization time tend toward the upper half of that range.
Can seismic tomography detect karst features in the limestone beneath Newmarket?
Yes, refraction tomography is one of the primary geophysical methods for identifying air-filled or clay-filled solution cavities in the Bobcaygeon and Verulam formations that underlie the moraine. A cavity appears as a localized low-velocity anomaly—typically 800–1,500 m/s within a background of 3,500–4,500 m/s—and the wavepath eikonal tomography algorithm resolves anomalies with a diameter of at least one-half the geophone spacing. For cavities smaller than 1 m, we recommend supplementing the seismic survey with an electrical resistivity tomography line, which responds to the resistivity contrast between intact limestone and a clay-filled void.